David Myers, Ph. D.
Lada Kloi Gasparac, MA, MPA, NASPAA
January 2022
_______________________
¹This report is the eleventh in its series of reports that evaluates the effectiveness of programming administered within the Kentucky Department of Corrections Prison System under the Noa Counseling model. Previous analyses have been conducted by partners of Noa Counseling, namely Western Kentucky University’s Laura Brigman, Glacier Consulting, Schwartz and Associates, and Probatus Solutions. This report is prepared through a partnership by and between Noa Counseling and Joyfields Institute. It is the first report of its kind, as it is the first one to evaluate progress of programming administered in the Restrictive Housing Unit. The authors would like to thank the Administrators within the Kentucky Department of Corrections, Commissioner Cookie Crews, Deputy Commissioner Randy White, Program Branch Manager Debbie Kays, Director of Information Technology Services and Offender Information Services Beth Moore. A special thanks goes to the Wardens, Deputy Wardens, Treatment and Classification Officers, the Security Staff, and the NOA Counseling staff. Thank you for the dedication and work. This collective effort portrays the effectiveness of the programs under the administration and model of NOA Counseling, with emphasis on program fidelity, evidence-based practices, and focus on individual offender transformation.

Table of Contents
Data Highlights, Definitions, and Research Questions
Detailed Program Evaluation: Data and Findings
Executive Summary
Since the 1880’s, Departments of Corrections and Universities worldwide have systematically focused on bridging the gap between practice and education in the sciences of criminal justice, criminology, and administration of human behavior. Informed decision making was based on scholarly findings and the later application in the field. Historically, correctional administration has transformed based on choice of control model, justice mandates, characteristic and profile of offenders, and findings provided by scholars. These models were adapted for a variety of reasons, ranging from finding meaningful tactics that would detain criminals for their sentenced term, ensuring safety for the community and staff, or rehabilitating detected problems and patterns observed within the ever-changing population. Since the 1930’s, research informed policy instructed evaluation of practice and operational methods, signaling the most effective and efficient administrative methodologies, demarcated by time, money, and feasibility. Since the early 1990’s, correctional administration has shifted focus again toward highlighting the use of rehabilitative and restorative justice models, focusing on releasing the inmate with profitable tools in hopes for successful reintegration and decreased recidivism. Locally, Kentucky implemented HB 463 in 2011 that mandated the use of evidence-based practices under CPP Policy 5.3 and gauged effectiveness of current methods. Its continued modification ensured that the policy mandates would continue evaluating the impact of practices and programs, as well as the quality (fidelity) of services by and for user’s, consumers, and clients. Ultimately, the goal for the Kentucky Department of Corrections is to provide the most meaningful practices to its population.
Early in the evaluation of best practices within corrections, rehabilitation efforts such as Substance Abuse Treatment (SAP), Sex Offender Treatment (SOTP), Offender Reintegration and Re-Entry, Motivational Interviewing (MI), Cognitive Behavioral Therapy (CBT), Drug Courts (TDC), etc. have generated results of effectiveness when administered under strict guidelines and training. KY Department of Corrections thus contracted with Correctional Healthcare Companies and NOA Counseling, LLC for the administration and oversight of evidence based programming needs, excluding Substance Abuse Programs (SAP) and Sex Offender Treatment Programs (SOTP). In 2010, KYDOC adapted contractual rehabilitation efforts later taken on by Correctional Healthcare Companies (CHC) and then NOA Counseling, LLC (NOA), among other private contracts. 2010 marked the beginning of an impactful program journey that involved the program authors, the KYDOC Administration, the contractor providing programming, the institutional staff, and offenders.
Over the course of several years, following the enactment of HB 463, Adult Institutions within KY Corrections assessed current practices, divided such into categories of Evidence Based Practices (EBP) or Promising Practices (PP); monitored the needs of offenders that dynamically changed over time; and implemented programming and practices based on the RNR model (Risk Needs and Responsivity). Outcome research and trends analysis evaluated the effectiveness of such programs, with several internal reporting intervals. As evidence-based programming received much attention within the Adult Institutions, so did the focus on after-care and replicating rehabilitation efforts in less restrictive housing, translated into program application in Jails, Re-Entry Centers, Halfway Houses, Veterans Hospitals and Probation and Parole Offices within the community. Expansion from Moral Reconation therapy, a highly effective Cognitive Behavioral Therapy model, guided the use of the Transtheoretical model and the RNR model, amplified by present-focused therapy and Motivational Interviewing. A combination of the most effective communication, evaluation, and administration models is representative in the data report supplied here.
What we know to date?
Since the 1980’s, correctional administrations have contributed considerable resources to identify, implement and research effective management tools for offenders that frequently show an inability to maintain acceptable conduct within an institutional setting. The use of Restrictive Housing (also referred to as segregation, Special Management Unit, Special Housing Unit, or Transitional Housing Unit) was historically utilized as a tool to isolate those who engaged in behavior that threatened the safety and security of the institution and/or self. This practice grew over time, as disciplinary reports continued to mount. Meanwhile, controversial research showing negative impacts of time spent in isolation provided administrators with ideas to look deeper into the management of their own offenders, staff, and yards. The Kentucky Department of Corrections (KYDOC) explored this idea, placing targeted rehabilitation efforts at the forefront of interest. Thus, over the last several years, KYDOC has evaluated patterns of concern in managing troublesome offenders, reducing disciplinary infractions (severity and number of offenses), and changing the prison culture.
Restrictive Housing originated under the Pennsylvania System, or the “silent system”, at Eastern State Penitentiary in 1829. Individual cells were constructed to aid in isolating offenders for hours at a time. The use of these isolation cells replicated across the world until the 1870’s, when the National Prison Association developed a guide for improvements that would later result in the implementation of rehabilitative efforts and re-entry initiatives. (National Prison Association, 1870) According to O’Keefe (2008), inmates in restrictive housing are more disruptive, significantly more difficult to manage, tend to be of younger age, have higher rates of personality disorders (such as antisocial personality disorder), present with higher cases of criminality, and have a history of both violent offenses and substance abuse. Understanding this population aids correctional departments in providing targeted rehabilitation efforts (risk, needs, and responsivity) and initiatives to reduce the seriousness and frequency of disciplinary infractions. This ultimately changes the prison culture and assists offenders in transitioning to a less restrictive environment. In 2005, U.S. prisons held 81,622 offenders in restrictive housing, noting a 40% increase between 1995 and 2000. (Federal Sentencing Reporter, 2011)
Program Overview
The RHU Transitional Behavioral Management Unit Program is uniquely designed with the assistance of extensive research about worldwide rehabilitative efforts that target high-risk offenders and their individual needs. Needs are determined based on length and depth of history of symptomology, infractions, engagement, individualized management, transition, and supervision requirements. This program was designed with proven models, blending CBT, Cognitive Self Change, Motivational Interviewing, and Trauma Informed Care. This program was redefined in early 2020 through a collaboration with the New Zealand Department of Corrections, a model program for high-risk offenders. In this program, clients are progressively led through stages of change through a series of assignments and groups. The blend of modalities results in targeted dosage, frequency, and diversity to treat even the most treatment-resistant client. The variety of exercises (testimony, homework, planning and brainstorming, listing, measuring, drawing, and researching) help each client learn and move forward in the most comfortable, but challenging way. The program has been written with adult learning principle in mind. Clients transition through stages (phases) of measurable success while receiving increased reinforcement (incentives) for positive progression. The model is open-ended and swiftly focuses on violations. It allows clients to shift between phases without disrupting the progress of others. The clients’ last stage occurs in general population, essentially a transition into less restrictive housing.
Criteria for Admission/Referral Process
Utilizing the multi-disciplinary management team approach, the Classification Committees within the 12 adult institutions are responsible for reporting clients who are high risk, repeat offenders, and/or frequent visitors to the restrictive housing units. The Central Office Classification Committee then reviews each client for placement and transfer into program openings: Kentucky Correctional Institution for Women (KCIW) client capacity - 8, Western Kentucky Correctional Complex (WKCC) client capacity -16, Kentucky State Penitentiary client capacity – 24 and Eastern Kentucky Correctional Institution (EKCC) client capacity - 24. Offenders voluntarily apply under the Committee’s recommendation, with the understanding that program completion may result in Administrative Control review, release to general population, and grant up to 90 days educational good time for the extended programing for the male population. For programming offered at KCIW for female clients, the educational good time is 45 days considering the length of the program (it is less intensive while in the Restrictive Housing Unit, is shorter in time, and offers a direct path to evidence-based programing post release to general population). Note that program design is based on strengths/needs/risks of the population, processing times within the facility, and research on gender-specific programing. Furthermore, offenders contribute to the recommended transfer location post completion, and are immediately enrolled in Seeking Safety, a present centered process group that targets PTSD, Substance Abuse, Compulsive Behaviors, and other Traumas. While in general population, participants completed Seeking Safety in a group setting, receive Case Management as needed post Seeking Safety, and have one-on-one Case Consultations with their previous facilitator (10 times over the 6-month period). During this follow-up time, participants are not allowed to receive a Cat 3-11, Category 4, or higher Disciplinary Write Up or they are terminated from the program.
Intake, Orientation, Assessment Tools, Tracking
An intake is conducted by the receiving institution upon arrival of the client. Individual needs are discussed in the first behavioral management team meeting to educate and prepare for organized sessions. The use of the Violence Risk Scale aids as a pre-and-posttest measure and to guide individual domains throughout the process. Assessment findings and the proposed structure of programming are discussed with the client. The behavioral management team is in place, in order to:
- Build rapport
- Validate the inmate’s profile, including risks and needs
- Engage the offender in developing a program and management plan that works for them
- Help improve the offender’s motivation to participate in the Transition Unit
Furthermore, facilitators conduct progress tracking during each session and report findings (observable and subjective) to the behavioral management team. This continues even after an offender is transitioned to another prison yard for the last phase. Discussion about individual rehabilitation efforts and progress are conducted at the originating institution.
General Expectations of Participants
Clients are to adhere to the program and unit rules/standards. Many program rules are developed with the clients to increase buy-in. Each individual is to care for his/her property, vocalize needs and concerns, complete all work prior to group sessions, engage in discussion and presentation, and participate in the planning process for transition. Some of the unit standards include maintaining medication compliance, maintaining personal hygiene, maintaining cell cleanliness, not engaging in harmful or threatening remarks or acts against self or others, and maintaining positive communication with other clients and staff.
Behavioral Management Groups
Rehabilitation groups meet with 4-8 clients for 1.5 hours per day, 3-4 times per week, with a trained facilitator. The core curriculum for these guided groups is Cognitive Self Change and later Seeking Safety.
Incentives/Contingency Management
Incentives are pre-determined by the institution and contractual provider, utilizing the results of a preferential assessment that polled volunteer (offender) responses from all KYDOC facilities. Incentives were established to enhance extrinsic motivators. The following are some of the items on the preferential assessment: additional phone calls; increased canteen spending; increased canteen item availability; access to Fresh Favorites; access to music via iPod, radio, or mp3 player; access to television or group movie nights with pop-corn; increase in recreational time; increase in shower (duration and frequency); contact visitation; yard time; permission to utilize weight pile; eating with the group; being unrestrained; utilizing chaplain/chapel/religious services; and receiving snack foods. Incentives were divided by phase. Client progress signals the addition of an extrinsic incentive.
Multi-disciplinary Team
Weekly meetings are held to discuss client progress, needs, regression, and adaptations. Each discipline provides a unique perspective into the client’s process of change: medical health (medication and medical management, private contractor WellPath), mental health (assessment, psychological assistance, referrals, private contractor WellPath and KYDOC staff), behavioral health (contractual, clinical and psychoeducational staff Noa Counseling, and KYDOC clinicians), classification (re-entry, transfer, case management and program placement needs), unit staff (daily interaction, safety and security, liaison between all disciplines, electronic tracking, management of individual behavioral plan), administrators (supervision, training, finalization/approval), and correctional officers (client supervision, monitoring and daily communication). Expert observations and analysis of each client are shared during weekly meetings. This ongoing and collaborative communication provides for strong oversight of the client, the program, and the outcome.
Training
Counselors, social service clinicians, unit staff, administrators, and select line staff are trained in a variety of evidence-based practices. CBT manualized training includes certification and/or familiarization in like models to go beyond the staff conducting groups, to also security and administrative staff. Communication techniques address adult learning styles unique to criminal and treatment-resistant clients. Intrinsic compliance is fostered using motivational interviewing, active listening, de-escalation, and relaxation techniques. Substance abuse treatment models are added to assist with education and relapse. These varied approaches are purposely intertwined to target antisocial personality traits often associated with the population served.
Phasing/Staging
Upon completion of a phase, each client is physically transitioned into another housing unit or living quarter with those that are at the same treatment level. Each phase is open-ended, meaning that clients can come in at any time and participate in the group. Moreover, each phase is presented with higher levels of treatment material as expectations of moral reasoning increase. Violation of program or unit rules may set clients back, require them to repeat material, and/or lose incentives.
Aftercare
The multi-disciplinary behavioral management team engages the client in transition planning four weeks prior to program completion. Each client selects up to three facilities for transfer, explaining why he/she believes the movement will assist in conduct maintenance and an easier adaptation to general population. Once the location and programming are determined, the information is then communicated to the Classification Branch and the receiving institution. The receiving institution notifies their staff and facilitators of the client’s individualized needs, risks, and struggles. Enrollment into Seeking Safety, another 6-month process with Intensive one-on-one Case Management suits as the final phase of the rehabilitative process. The above outline fits the model of the male- prisons.
Kentucky Correctional Institution for Women operates a shorter program, with aftercare ranging from 3-6 months and no immediate enrollment into evidence-based programing following. The modality, curriculum, and mentality of the program are like the male-prison programming.
Data Highlights, Definitions, and Research Questions
This is a study of implementation and administration of programming within Kentucky Department of Corrections, facilitated by NOA Counseling trained staff within the Restrictive Housing Unit. Program implementation is motivated by a contract by and between NOA Counseling and KY KCIC. The programs are enacted to enhance program participants’ behaviors and thinking patterns, reduce substance abuse and violence in the institution, assist with mental health needs, and help clients with a safer transition into the community.
Data Highlights
Data were obtained from the KY Department of Corrections unit for Offender Information Services and Information Technology Services. Any data obtained for any programming pre 5-15-2018 for all four institutions were excluded due to the onset of NOA Counseling program structure enactment following the date of analysis. Accidental duplications, client enrollment for less than 15 days in programming, and multiple assignments caused by group and scheduling changes were also excluded from this study. All calculations and tables were generated using STATA and SPSS.
Methods
This research was based on secondary analysis of the program participants’ data that were obtained from the Kentucky Department of Corrections. After the data was cleaned, merged, and coded, it was subjected to univariate, bivariate, and multivariate analysis to answer four research questions. The analytic strategy used included the evaluation of variable descriptive statistics, T-tests to evaluate the bivariate relationships and effect sizes, multivariate Linear Regression (to determine the predictors of outcomes), and lastly, Logistic Regression analysis to determine predictors of returning to prison for those released.
Definitions and Abbreviations
MRT Extended Behavioral Modification: Program Name utilized pre 10-1-2020 to represent long-term programming (6 months – 1 year) conducted at EKCC and KSP (moderate to high-risk, male institution).
WKCC RHU Transition Program – Program Name utilized prior to 10-1-2020 to represents programming conducted at WKCC (medium-risk, male institution)
MRT Administrative Behavioral Modification – Program Name utilized prior to 10-1-2020 to represent programming conducted at KCIW (female institution).
RHU Transitional Behavioral Modification Program – Program Name utilized post 10-1-2020 to represent long-term programming (6 months – 1 year) conducted at EKCC and KSP (moderate to high-risk, male institution).
RHU Administrative Behavioral Modification - Program Name utilized post 10-1-2020 to represent programming conducted at KCIW (female institution).
*The re-name of the RHU program for WKCC has not been included, as the program transitioned with an end date pre 10-1-2020.
Other Definitions
KYDOC – Kentucky Department of Correction
Facilitator – Persons defined as counselors of the program modality
Client/Offender – Participants of the program within the CCDC programs
Modality – Program structure and style
DR – Disciplinary Write Up Category 1 through 7 in level of severity
Status – Program Status based on program activity of one client
Security Level – level of security upon enrollment into the program
Recidivism – prison release with return for participant
RHU – Restrictive Housing Unit
Evaluated Prisons with Abbreviations
- Eastern Kentucky Correctional Complex (EKCC) - moderate to high-risk male offenders
- Kentucky Correctional Institution for Women (KCIW) – moderate to high-risk female offenders
- Kentucky State Penitentiary (KSP) - moderate to high-risk male offenders
- Western Kentucky Correctional Complex (WKCC) – medium-risk male offenders
Research Questions
This report evaluates the effectiveness of programming administered in the Restrictive Housing Unit, with added evaluation of the offender profile during the pre-during-post programming time periods. The data obtained reviews information of offenders housed for programming at Kentucky Correctional Institution for Women (KCIW), Western Kentucky Correctional Complex (WKCC), Kentucky State Penitentiary (KSP), and Eastern Kentucky Correctional Complex (EKCC). The program’s evaluation in terms of time includes offenders in programming from 5-15-2018 through 6-1-2021. 523 unique cases comprise the population pool of offenders assessed in this review.
The establishment of such comprehensive program delivery is suited for answering specific questions in terms of practice, rehabilitation, and offender progress and outcome. As such, the development of practice aids in answering the following questions:
-
-
- What are the characteristics of the participants in Restrictive Housing Unit Programming?
- Did RHU program participants experience a reduction in Disciplinary Write-ups and additional Restrictive Housing placement during and following their participation in the program?
- What are the variables that predict reductions in Restrictive Housing placements for program participants?
- What variables predict return to prison (recidivism) among program participants?
-
1. What are the characteristics of the participants in Restrictive Housing Unit Programming?
This research question is answered through descriptive statistics using the 523 total cases representing program participants. Relevant tables are presented starting on page 12. The following is a summary of the descriptive statistics:
Location and Frequency of Program Enrollment: 18.5 % (97) of participants were housed at EKCC, 28.1% (147) were housed at KSP, 25.2% (132) were housed at WKCC, and 28.1% (147) were housed at KCIW. Further breakdown of descriptive statistics addresses the program type. Due to the severity and risk of the population, frequency of program enrollment varied from 1-4 times, of which 70.7% (370) participants were in the program one time, 21.8% (114) participants were in the program two times, 5.2% (27) participants were enrolled in the program three times, and 2.3% (12) participants were enrolled in the program four times. Moreover, evaluation of frequency of incarceration pre-program revealed 63.1% (330) participants being incarcerated for the first time, 26.4% being incarcerated 2 times, and the remaining 10.5% being incarcerated 3+ times. For evaluation accuracy, the research team reviewed program entries rather than program participants following the analysis of descriptive variables.
Program Enrollment Status: 11.7% (61) of participants were enrolled in the program at the time of the analysis, 61.6 % (322) had completed the program, and 26.7% (140) were allocated in other statuses.
Offender Profile: 28.1% (147) of the population was female, and 71.9% (376) was male. Most participants fell into 2 race/ethnicity profiles, namely 70.6% Caucasian/White, and 25.2% African American/Black. Age at start of programming showed that half of the overall participants were 20-29 years old, with the second highest being 36.7% for age range 30-39, and lastly 11.1% for age range 40-49. Most participants (63.5%) had completed their High School Graduation or obtained a GED, 19.9% had some High School Education, and 8.2 % had some College. In terms of Mental Health scoring, 59.3% (310) of participants had an MH-2 score, 18% (94) an MH-0 score, and 14% (73) had an MH-3 score.
Enrollment in Programming Pre-RHU: Based on the 523 cases representing program participants, about 78% were enrolled in other programs. Variables pertaining to other program enrollment are presented for the Pre-RHU Program and Post-RHU Program time periods. Evidence-Based (EB) programming was the most common type of programming and exhibited the longest duration, on average, for both the Pre-RHU Program and Post-RHU Program time periods.
DR Measures for Pre-During-Post Programming: Based on the 523 total cases, in all three time periods, the average frequencies were highest for Category 3 and Category 4 DRs. These two categories also presented the widest range of DR frequencies across the 523 cases. It is noteworthy that the average numbers of DRs were much higher during the Pre-RHU Program time period, lower during the Post-RHU Program time period, and very low for the During-RHU Program time period.
2. Did RHU program participants experience a reduction in Disciplinary Write ups and additional Restrictive Housing placement during and following their participation in the program?
This research question is answered through paired samples t-tests using the 523 total cases representing program participants. Relevant tables are presented starting on page 16. The following is a summary of the paired samples t-tests:
Paired Samples T-tests for Pre and During Program DR Frequencies (All Cases + Males/Females Separated)
These tests examine differences (changes) in average DR frequencies between the Pre RHU-Program and During-RHU Program time periods for all 523 cases. Subsequent comparisons are made with female and males assessed separately.
Overall, the average number of DRs for all 523 cases decreased significantly across all 7 DR Categories. The largest reductions occurred within Category 3 and Category 4. The effect sizes associated with the decreases in the average number of DRs ranged from moderate (Category 2) to large or very large across the 7 categories. These results indicate significant and substantial decreases in DRs between the Pre RHU-Program and During-RHU Program time periods.
When females and males were assessed separately, a similar pattern was revealed for both groups. The average number of DRs decreased significantly for both females and males across all 7 DR categories. For both groups, the largest reductions occurred within Category 3 and Category 4, and the effect sizes associated with the decreases again ranged from moderate to very large for both males and females.
Paired Samples T-tests for Pre-and-Post Program Disciplinary Write-Up Measures with Completed Program Status only (All Cases + Males/Females Separated)
These tests examine differences (changes) in average DR frequencies between the Pre-RHU Program and Post-RHU Program time periods, based on the 322 cases of program completers. The initial assessment examines these differences for all 322 completed cases. Subsequent assessments make the same comparisons, but with females and males assessed separately.
Overall, the average number of DRs for all 322 completed cases decreased significantly across 6 of the 7 DR Categories (the reduction in Category 1 DRs was not statistically significant). The largest reductions occurred within Category 3 and Category 4. The effect sizes associated with the decreases ranged from weak (Category 1 and Category 2) to moderate (Category 5, Category 6, and Category 7) to large (Category 3 and Category 4). These results indicate significant and consistent decreases in DRs between the Pre RHU-Program and Post-RHU Program time periods.
When males and females were assessed separately, the average number of DRs decreased significantly for both groups in DR Categories 3, 4, 5, 6, and 7. For both groups, the largest reductions occurred within Category 3 and Category 4. Males also exhibited significant reductions in Category 1 and Category 2. For females, the DR reduction in Category 2 was not statistically significant, and females also exhibited a significant increase in Category 1 DR’s.
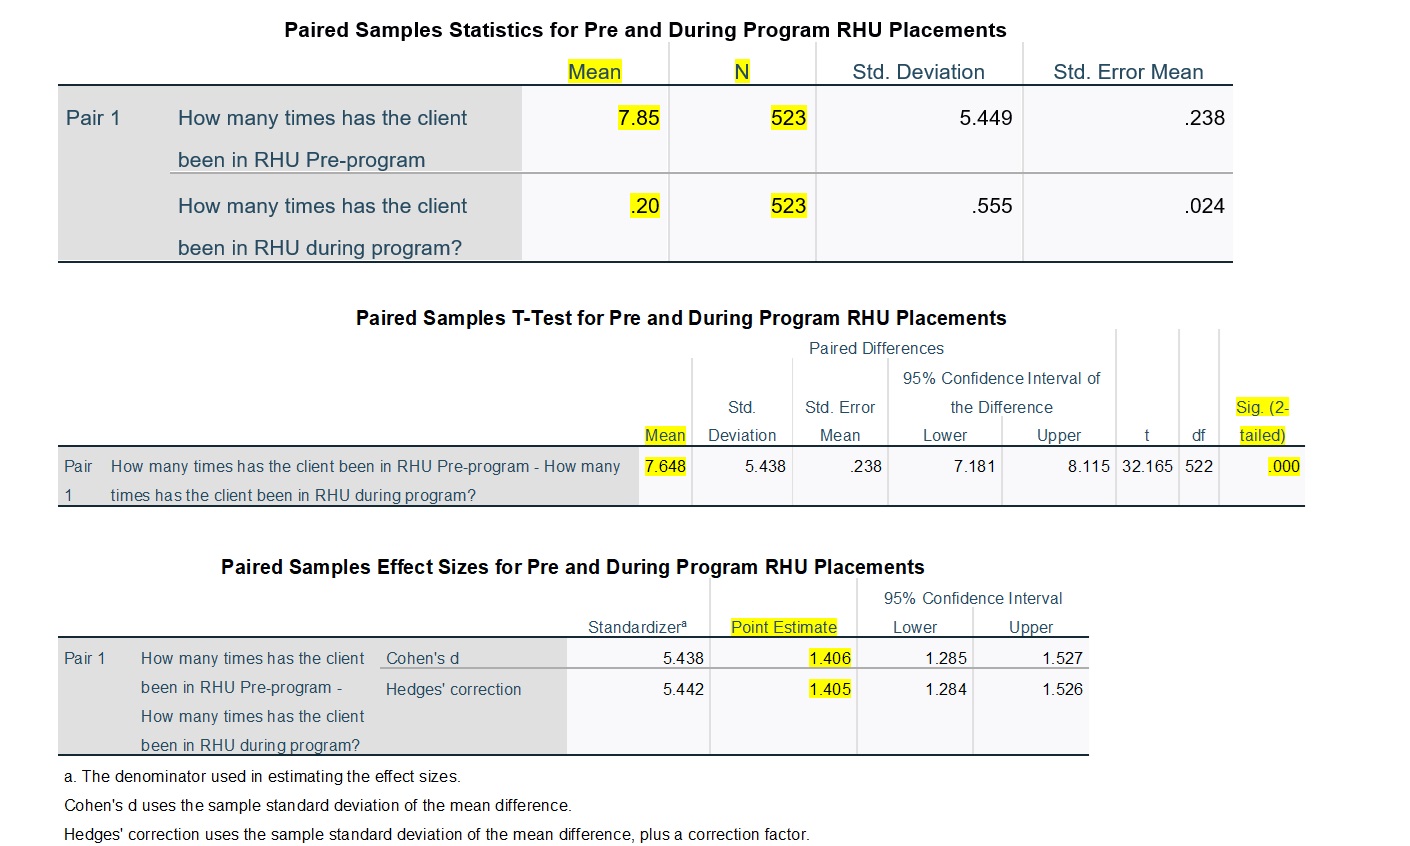
Paired Samples T-tests for Pre-and-During Program RHU Placements (All Cases + Males/Females Separated)
These tests examined differences (changes) in the average number of RHU placements between the Pre RHU-Program and During-RHU Program time periods. The initial evaluation examines these differences for all 523 cases representing program participants. Subsequent assessments make the same comparisons, but with females and males assessed separately.
Overall, the average number of RHU placements for all 523 cases decreased significantly, with a very large effect size. This reduction in RHU placements was also statistically significant for both females and males, with a slightly larger effect size revealed for males. These results indicate significant and substantial decreases in RHU placements between the Pre RHU-Program and During-RHU Program time periods.
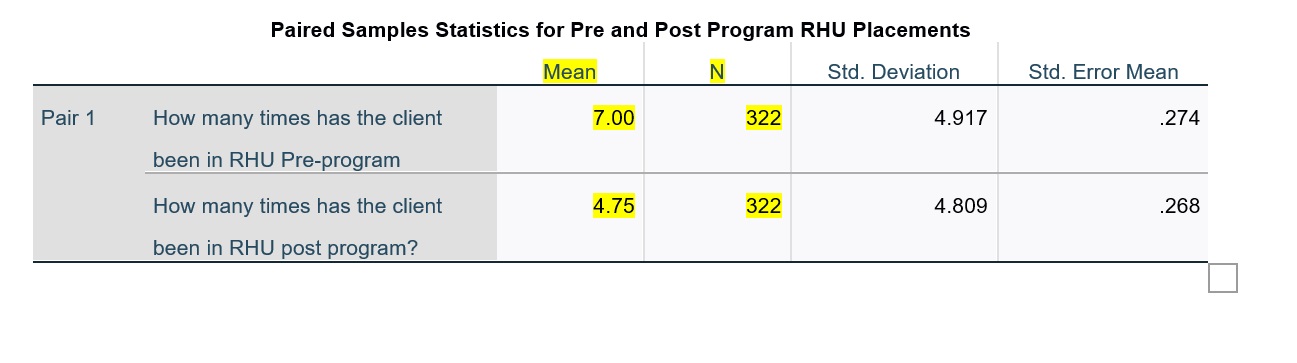
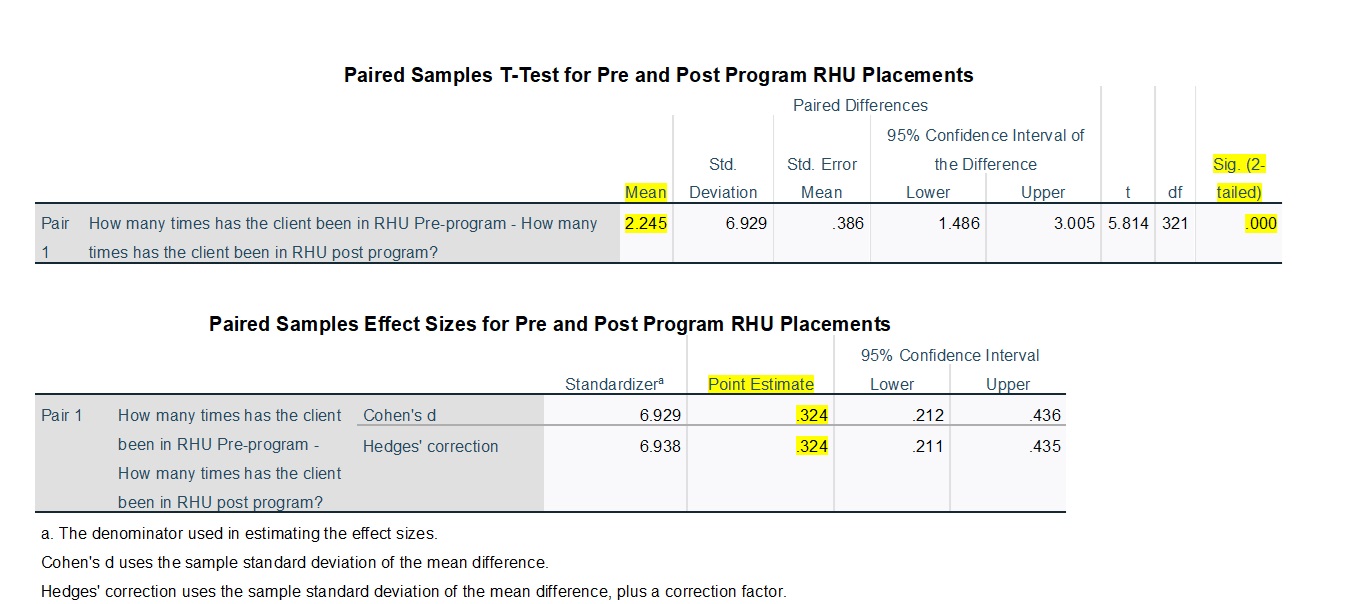
Paired Samples T-tests for Pre-and-Post RHU Placements with Completed Program Status only (All Cases + Males/Females Separated)
These tests examine differences (changes) in the average number of RHU placements between the Pre RHU-Program and Post-RHU Program time periods, for the 322 cases representing program completers. The initial evaluation examines these differences for all 322 completed cases. Subsequent assessment make the same comparisons, but with males and females assessed separately.
Overall, the average number of RHU placements for all 322 completed cases decreased significantly, with a moderate effect size. However, the separate analysis of female and male cases revealed that the reduction in RHU placements was significant only for males, with a moderate effect size.
3. What are the variables that predict reductions in Restrictive Housing placements for program participants?
Linear Regressions for Differences in Pre-and-During Program RHU Placements (All Cases + Males/Females Separated)
A linear regression analysis of the predictors of the size of the difference (decline) in RHU placements between the Pre-RHU Program and During-RHU Program time periods was based on all 523 cases, with a subsequent analysis of females and males conducted separately. A detailed description of the linear regression results begins on page 18; the following is a summary of the findings:
With all cases included, a higher level of education was significantly associated with a smaller change (decline) in RHU placements, for the Pre RHU-Program and During-RHU Program time periods. In other words, a lower level of education was associated with a significantly larger change/decline. In addition, a higher mental health level diagnosis was associated with a significantly larger change/decline, and a longer duration of evidenced-based programming during the Pre RHU-Program time period also was associated with a larger change/decline as well. Finally, participants in the MRT Extended Behavioral Modification Program, the RHU Transitional Behavioral Modification Program, and the RHU Administrative Behavioral Modification Program exhibited significantly larger changes as compared to participants in the WKCC RHU Transition Program, while participants in the MRT Administrative Behavioral Modification Program exhibited a significantly smaller change compared to participants in the WKCC RHU Transition Program.
For female cases, an older age at the start of the program and a longer duration of evidence-based programming during the Pre RHU program time period were associated with a significantly larger change (decline) in RHU placements, while a higher level of education was significantly associated with a smaller change. In addition, participants in the MRT Behavioral Modification Program exhibited a significantly smaller change compared to participants in the RHU Administrative Behavioral Modification Program.
For male cases, a higher mental health level diagnosis was associated with a significantly larger change (decline) in RHU placements. In addition, participants in the MRT Extended Behavioral Modification Program and the RHU Transitional Behavioral Modification Program exhibited significantly larger changes as compared to participants in the WKCC RHU Transition Program.
A final model revealed that participants from EKCC exhibited significantly smaller reductions in RHU placements, as compared to participants from WKCC, KCIW, and KSP. This model also revealed the same type of significant associations for level of education, level of mental health diagnosis, and duration of evidence-based programming, as noted in the paragraphs above. Overall, these findings point to the importance of considering risk factors associated with education and mental health, along with offering evidence-based programming, when providing treatment to incarcerated individuals.
Linear Regressions for Difference in Pre-and-Post Program RHU Placements (All Cases + Males/Females Separated)
A linear regression analysis of the predictors of the size of the difference (decline) in RHU placements between the Pre-RHU Program and Post-RHU Program time periods included the 322 cases representing program completers. The initial analysis was based on all 322 completed cases, with a subsequent analysis of females and males conducted separately.
With all 322 completed cases included, an older age at the start of the program was associated with a significantly larger difference (decline) in RHU placements, with regard to the Pre RHU-Program and Post-RHU Program time periods. In addition, a longer duration of evidenced-based programming during the Pre-RHU program time period was associated with a larger change (decline) in RHU placements, while a longer period of post-program time at risk was associated with a smaller difference. Finally, participants in the MRT Administrative Behavioral Modification Program exhibited a significantly smaller change compared to participants in the WKCC RHU Transition Program.
For female cases, a longer duration of evidenced-based programming during the Pre-RHU program time period was associated with a significantly larger change (decline) in RHU placements, while a longer period of post-program time at risk was associated with a smaller difference. For male cases, an older age was associated with a significantly larger change (decline) in RHU placements, while a longer period of post-program time at risk was associated with a smaller difference.
A final model revealed that participants from EKCC exhibited significantly smaller reductions in RHU placements compared to participants from KCIW. This model also revealed the same significant associations for age, duration of evidence-based programming, and time at risk, as noted in the paragraphs above. These findings again suggest the importance of offering evidence-based programming when providing treatment to incarcerated individuals.
4. What variables predict return to prison (recidivism) among program participants?
Logistic Regression Analysis for Return to Prison
This analysis examined 149 cases representing program participants who had been released from prison at the time data were obtained. Of these cases, 16% (24) participants were returned to prison. The logistic regression analysis identifies the significant predictors of returning to prison. Due to missing data, 146 cases were included in the logistic regression analysis.
The results indicated individuals with a higher mental health level diagnosis were significantly more likely to return to prison. In addition, a longer duration of evidence-based programming during both the Pre RHU-Program and Post-RHU Program time periods was associated with a lower likelihood of returning to prison. Finally, a longer period of post-release time-at-risk lowered the likelihood of returning to prison (i.e., returning to prison was likely to occur more quickly following release). Overall, these findings confirm the importance of considering mental health status and offering evidence-based programming when providing treatment to incarcerated individuals.
Detailed Program Evaluation: Data and Findings
*The below information aids in further explaining the responses that have been supplies in the Research Question section of this report. Furthermore, additional Tables, graphs and descriptions can be provided shall the DOC have interest.
Case Characteristics
The following tables provide descriptive statistics based on the 523 total cases representing program participants. The variables presented include program location, type of program, number of entries for the participants, participant status in the program, various demographic characteristics, participant mental health level, and number of incarcerations.
Demographics: Out of the 523 total cases representing the program participants, 147 (28%) were Female and 376 (72%) were Male. The following is the distribution by race and age of participants. In terms of Age, the mean (average) was 31.47 years, the median was 29, and the mode was 28. Age ranged from minimum of 20 to maximum of 64.
|
Race/Ethnicity |
|||||
|
|
Frequency |
Percent |
Valid Percent |
Cumulative Percent |
|
|
Valid |
Caucasian/White |
369 |
70.6 |
70.6 |
70.6 |
|
African American/Black |
132 |
25.2 |
25.2 |
95.8 |
|
|
Hispanic/Latino |
13 |
2.5 |
2.5 |
98.3 |
|
|
Bi-Racial |
7 |
1.3 |
1.3 |
99.6 |
|
|
Indian or Pacific Islander |
2 |
.4 |
.4 |
100.0 |
|
|
Total |
523 |
100.0 |
100.0 |
|
|
|
Starting Age Ranges |
|||||
|
|
Frequency |
Percent |
Valid Percent |
Cumulative Percent |
|
|
Valid |
20-29 |
263 |
50.3 |
50.3 |
50.3 |
|
30-39 |
192 |
36.7 |
36.7 |
87.0 |
|
|
40-49 |
58 |
11.1 |
11.1 |
98.1 |
|
|
50-59 |
9 |
1.7 |
1.7 |
99.8 |
|
|
60-69 |
1 |
.2 |
.2 |
100.0 |
|
|
Total |
523 |
100.0 |
100.0 |
|
|
Education, Mental Health Status, and Prior Incarceration: Out of 515 cases (8 cases had missing information), the majority, namely 63.5% or 332 participants, completed their High School Education or GED. Out of 523 participants, all possessed MH scoring with most participants categorized as MH-2 (almost 60%) at the time the data were pulled, followed by MH-0 (18%) and MH-3 (14%). This distribution speaks to the MH risk and need for participants in the Restrictive Housing Unit. For 63% of participants, this was their first incarceration in State Prison. For 26% of participants, this was the second incarceration, and for the remaining 11%, there were 2 or more prior incarcerations.
|
||||||||||||||||||||||||||||||||||||||||||||||||
|
Number of Incarcerations (including current) |
||||||||||||||||||||||||||||||||||||||||||||||||
|
|
Frequency |
Percent |
Valid Percent |
Cumulative Percent |
||||||||||||||||||||||||||||||||||||||||||||
|
Valid |
1 |
330 |
63.1 |
63.1 |
63.1 |
|||||||||||||||||||||||||||||||||||||||||||
|
2 |
138 |
26.4 |
26.4 |
89.5 |
||||||||||||||||||||||||||||||||||||||||||||
|
3 |
44 |
8.4 |
8.4 |
97.9 |
||||||||||||||||||||||||||||||||||||||||||||
|
4 |
8 |
1.5 |
1.5 |
99.4 |
||||||||||||||||||||||||||||||||||||||||||||
|
5 |
3 |
.6 |
.6 |
100.0 |
||||||||||||||||||||||||||||||||||||||||||||
|
Total |
523 |
100.0 |
100.0 |
|
||||||||||||||||||||||||||||||||||||||||||||
Program Data: The distribution of number of participants per evaluated institution is equally distributed, with the exception of EKCC, which started its program at a later date (2019 as opposed to 2015). In terms of program enrollment, most participants were enrolled in MRT Extended Behavioral Modification, namely 36% (186). This is logical since both EKCC and KSP used enrollment into this program as the designation of duration and intensity of programming. Considering EKCC’s later inclusion into the Rehabilitative Efforts, the number is lower than expected. 25% of participants (129) were enrolled in WKCC RHU Transition Programming, which was specifically designed for programming for medium-risk offenders at WKCC, and 24% of participants were enrolled in MRT Administrative Behavioral Modification, a program specifically created for KCIW – female programming. The distribution by program is important for further analysis and comparison in terms of effectiveness and size of effectiveness. It is important to note that WKCC programming was placed on hold following several months of COVID-19 closures, namely in October 2020. At the same time, programming was re-named, and the remaining 12% (61) male participants and 7% (24) female participants were recorded under the RHU Transitional Behavioral Modification Program and the RHU Administrative Behavioral Modification Program. For purposes of this analysis, we have not combined the new name designation with previous programming. The assessors realize that participants of higher risk may relapse and require programming to be administered on more than one occasion. In terms of validity of effectiveness, this information is also important. Thus, the frequency of program enrollments is recorded. 71% of participants were exposed to programming one time, while 22% of participants were exposed more than one time. When evaluating the distribution, it can be concluded that predominantly female participants had more than 1 program entry, more frequently than their male counterparts. Statuses of program engagement is portrayed in the table below. At the time of data review, 12% were actively enrolled, 62% completed the program successfully, 14% were terminated, and the remaining 14% fit into other categories.
|
Program Location |
|||||
|
|
Frequency |
Percent |
Valid Percent |
Cumulative Percent |
|
|
Valid |
EKCC |
97 |
18.5 |
18.5 |
18.5 |
|
KSP |
147 |
28.1 |
28.1 |
46.7 |
|
|
WKCC |
132 |
25.2 |
25.2 |
71.9 |
|
|
KCIW |
147 |
28.1 |
28.1 |
100.0 |
|
|
Total |
523 |
100.0 |
100.0 |
|
|
|
Client Status Relevant to Program Achievement |
|||||
|
|
Frequency |
Percent |
Valid Percent |
Cumulative Percent |
|
|
Valid |
Assigned |
61 |
11.7 |
11.7 |
11.7 |
|
Completed |
322 |
61.6 |
61.6 |
73.2 |
|
|
Deferred |
14 |
2.7 |
2.7 |
75.9 |
|
|
Released |
2 |
.4 |
.4 |
76.3 |
|
|
Terminated |
72 |
13.8 |
13.8 |
90.1 |
|
|
Transferred |
8 |
1.5 |
1.5 |
91.6 |
|
|
Withdrew |
25 |
4.8 |
4.8 |
96.4 |
|
|
Other |
19 |
3.6 |
3.6 |
100.0 |
|
|
Total |
523 |
100.0 |
100.0 |
|
|
Enrollment in Other Programs Pre- and Post-RHU Programming: The following information provides descriptive statistics on enrollment in other programs, based on the 523 cases representing program participants. About 78% of the cases indicated enrollment in other programs. Variables pertaining to other program enrollment are presented for the Pre RHU-Program and Post-RHU Program time periods. Evidence-Based (EB) programming was the most common type of programming and exhibited the longest duration, on average, for both the Pre RHU-Program and Post-RHU Program time periods.
At any time, the average number of program enrollments per participant was 12, with a range between 1 and 48 enrollments.
Pre-RHU Program – For the distribution of Program Enrollment for the period Pre-RHU programming, 4 enrollments (ranging between 0 and 19 of enrollments for some participants) were in EB Programming, with an average of 378 days in duration (range was equal to 0 to 10,566 days of enrollment); about 2 enrollments (range was between 0 and 21 of enrollments for some participants) were in Educational Programming, with an of average 125 days in duration (range between 0 and 2181 days of enrollment); and less than 1 enrollment (range was between 0 and 9 enrollments for some participants) was in Vocational Programming, with an average of 36 days in duration (range was equal to 0 to 1334 days of enrollment).
Post-RHU Program - For the distribution of Program Enrollment for the period Pre-RHU programming, 2 enrollments (ranging between 0 and 13 enrollment for some participants) were in EB Programming, with an average of 207 days in duration (range was equal to 0 to 1744 days of enrollment); less than 1 enrollment was in Educational Programming (range was between 0 and 9 enrollments for some participants), with an average of 12 days in duration (range was equal to 0 to 488 days of enrollment); and less than 1 enrollment (range was between 0 and 4 enrollments for some participants) was in Vocational Programming, with an average of 9 days (range was between 0 and 697 days of enrollment) in duration. This depiction of ranges identifies cases that have a higher number of enrollments, for an extended period of time. However, for purposes of generalizability, averages are taken from the entire population.
DR Measures for Pre-, During-, and Post-RHU Programming
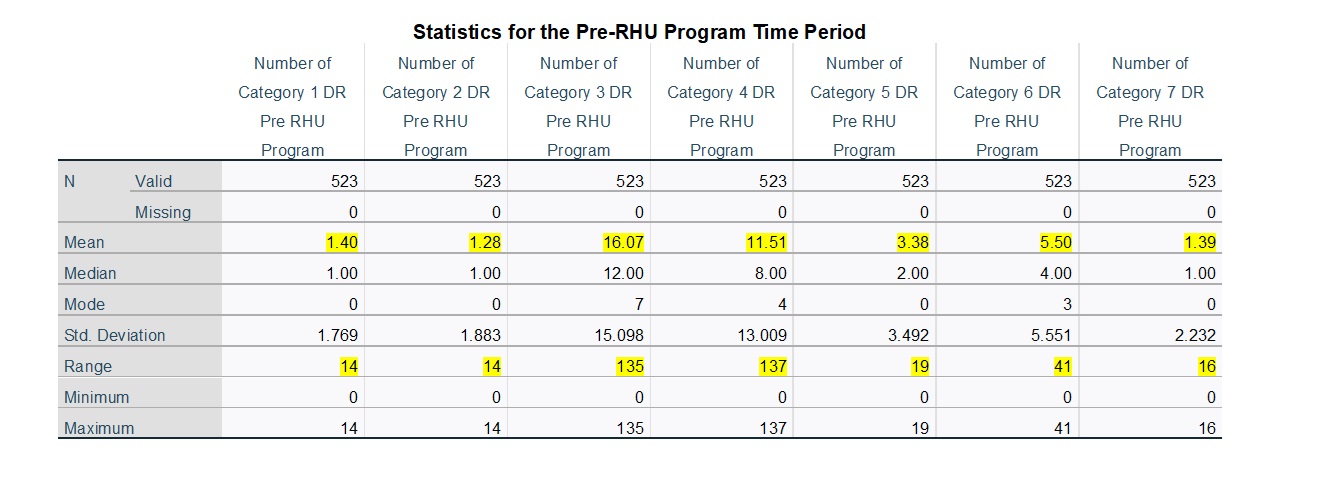
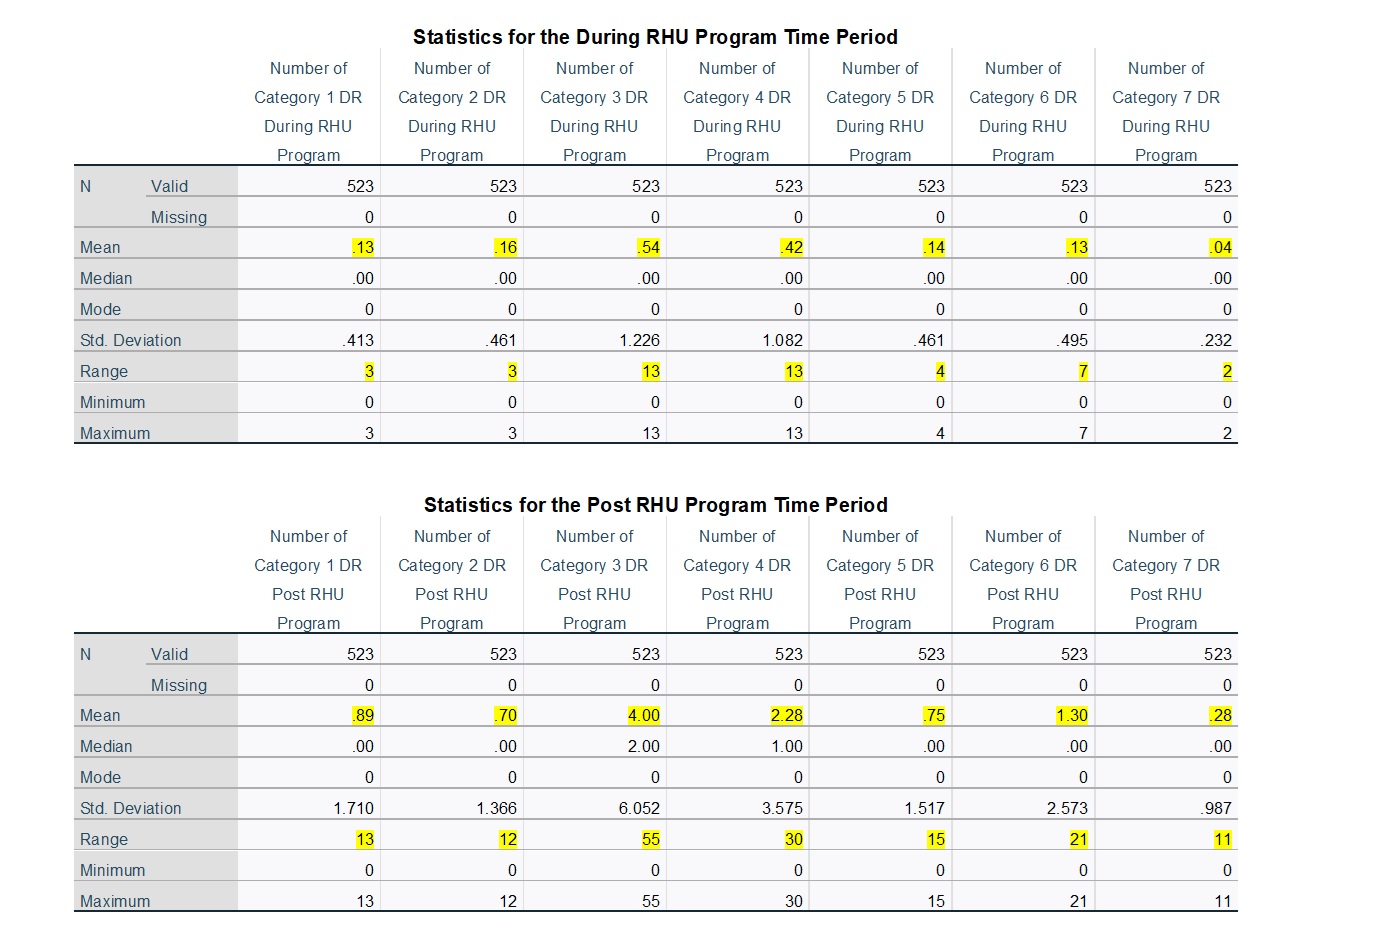
In order to produce an assessment of DRs, the following is based on descriptive statistics for the DR variables during the Pre-RHU Program, During-RHU Program, and Post-RHU Program time periods, for the 523 total cases. In all three time periods, the average frequencies were highest for Category 3 and Category 4. These two categories also presented the widest range of DR frequencies across the 523 cases. It is noteworthy that the average numbers of DRs were much higher during the Pre-RHU Program time period, lower during the Post RHU Program time period, and very low for the During-RHU Program time period. The highlighted information in the tables identifies important results. Based on these tables, the following interpretations can be made.
DR Categories 1 and 2 – Pre- and Post-RHU Programming, the average number of DR’s for Cat 1 and 2 are around 1 (with a range from 0-14). For this Category, the average and range differ only for During-RHU Programming, as the average is less than 1, with a range between 0 and 3. This is logical, as most Category 1 and 2 DR’s are not recorded or do not frequently occur in Restrictive Housing.
DR Categories 3 – 7 – In comparison, DR’s in Cat 3, 4, 5, 6, and 7 show declines in frequency and range of number of DR’s from Pre-RHU Programming to During-RHU Programming and for Pre-RHU Programming to Post-RHU Programming, with the most significant differences being in Category 3. For DR Cat 3, the average number of DR’s Pre-RHU Program was 16 (with a range of 0-135 for some participants). During RHU Programming that number reduced to less than 1 per participant (with a range of 0-13 for some participants), and for Post-RHU Programming, the average was 4 (with a range of 0-55 for some participants). Similar patterns (with lower differences) are seen for Categories 4, 5, and 6. Average DR’s for Cat 4 for Pre-RHU Program was 12 (with a range of 0-137), while During-RHU Program was less than 1 (with a range of 0-13), and for Post-RHU Program was a little more than 2 (with a range of 0-30). The Cat 5 average for Pre-RHU Program was 3 (with a range of 0-19), while During-RHU Program was less than 1 (with a range of 0-4), and for Post-RHU Program was a little more than 1 (with a range of 0-15). Lastly, for Cat 6, the average for Pre-RHU Program was 5.5 (with a range of 0-41), while During-RHU Program was less than 1 (with a range of 0-7), and for Post-RHU Program was a little more than 1 (with a range of 0-21).
Examination of Difference/Changes from Pre-RHU Programming to During-RHU Programming in terms of DR by frequency and Category. - Overall, the average number of DRs for all 523 cases decreased significantly across all 7 DR Categories. The largest reductions occurred within Category 3 and Category 4. The effect sizes associated with the decreases in the average number of DRs ranged from moderate (Category 2) to large or very large across the 7 categories. These results indicate significant and substantial decreases in DRs between the Pre RHU-Program and During-RHU Program time periods. When females and males were assessed separately, a similar pattern was revealed for both groups. The average number of DRs decreased significantly for both females and males across all 7 DR categories. For both groups, the largest reductions occurred within Category 3 and Category 4, and the effect sizes associated with the decreases again ranged from moderate to very large for both males and females.
Examination of Difference/Changes from Pre-RHU Programming to Post-RHU Programming in terms of DR by frequency and Category. – For this category only clients who have completed the program in its entirety are reviewed, namely 322 completed cases. Overall, the average number of DRs for all 322 completed cases decreased significantly across 6 of the 7 DR Categories (the reduction in Category 1 DRs was not statistically significant). The largest reductions occurred within Category 3 and Category 4. The effect sizes associated with the decreases ranged from weak (Category 1 and Category 2) to moderate (Category 5, Category 6, and Category 7) to large (Category 3 and Category 4). These results indicate significant and consistent decreases in DRs between the Pre-RHU Program and Post-RHU Program time periods. When males and females were assessed separately, the average number of DRs decreased significantly for both groups in DR Categories 3, 4, 5, 6, and 7. For both groups, the largest reductions occurred within Category 3 and Category 4. Males also exhibited significant reductions in Category 1 and Category 2. For females, the DR reduction in Category 2 was not statistically significant, and females also exhibited a significant increase in Category 1 DRs.
Examination of Difference/Changes from Pre-RHU Programming to During-RHU Programming in terms of frequency of RHU Placement for disciplinary or protective factors - Overall, the average number of RHU placements for all 523 cases decreased significantly, with a very large effect size. This reduction in RHU placements was also statistically significant for both females and males, with a slightly larger effect size revealed for males. These results indicate significant and substantial decreases in RHU placements between the Pre-RHU Program and During-RHU Program time periods.
Examination of Difference/Changes from Pre-RHU Programming to Post-RHU Programming in terms of frequency of RHU Placement for disciplinary or protective factors. – For this category only clients who have completed the program in its entirety are reviewed, namely 322 completed cases. Overall, the average number of RHU placements for all 322 completed cases decreased significantly, with a moderate effect size. However, the separate analysis of female and male cases revealed that the reduction in RHU placements was significant only for males, with a moderate effect size.
Based on the above results, reductions in both DR frequencies and additional RHU placements due to disciplinary infractions were statistically significant through use of T-test analyses. Additional results provided information on generally impressive levels of effect sizes.
Subsequent Linear Regression analyses assessed predictors of the already established statistically significant changes/reductions. The analyses were conducted to assess RHU Placements due to DR Write-ups for the Pre-RHU Program and During-RHU Program time periods (based on 523 cases) and for the Pre-RHU Program and Post-RHU Program time periods (based on 322 cases).
With all cases included, the following can be concluded for the Pre-RHU Program and During-RHU Program time periods. The WKCC RHU Transition Program was used as the base comparison group for All cases and Male cases, and the RHU Administrative Modification Program was used as the comparison for Female cases only:
For All Cases:
- A higher level of education was significantly associated with smaller changes in RHU placements
- A lower level of education was significantly associated with larger changes in RHU placements
- A higher Mental Health score was significantly associated with a substantially larger change in RHU placements
- A longer duration of EB (evidence-based) programming was significantly associated with a substantially larger change in RHU placements
- Participants in RHU Transitional Behavioral Modification and RHU Administrative Behavioral Modification exhibited significantly larger changes as compared to participants in WKCC RHU Transition. Please note smaller sample size.
- Participants in MRT Administrative Behavioral Modification Program exhibited a significantly smaller change as compared to participants in WKCC RHU Transition.
For Females:
- An older age at the start of the program was associated with larger changes in RHU placements
- A longer duration of EB programming Pre-RHU Program was associated with larger changes in RHU placements
- A higher level of education was significantly associated with smaller changes in RHU placements
- Participants in MRT Behavioral Modification Program exhibited a significantly smaller change compared to participants in RHU Administrative Modification Program. Please note smaller sample size.
For Males:
- A lower level of Mental Health score was associated with significantly larger changes in RHU placements
- Participants in MRT Extended Behavioral Modification and RHU Transitional Behavioral Modification program exhibited a significantly larger change as compared to participants in the WKCC RHU Transition Program.
Additional Observations:
- Participants from EKCC exhibited significantly smaller reductions in RHU Placements as compared to WKCC, KCIW, and KSP. This could be explained by EKCC’s later start/inclusion into the initiative.
- This same model revealed the same type of significant associations for level of education, level of mental health score, and duration of evidence-based programming.
With 322 cases included who completed the RHU program in its entirety, the following conclusions can be drawn for the Pre-RHU Program and Post-RHU Program time periods. The WKCC RHU Transition Program was used as the base comparison group for All cases and Male cases, and the RHU Administrative Modification Program was used as the comparison for Female cases only:
For All Cases:
- An older age at the start of the program was associated with significantly larger changes in RHU placements
- A longer duration of EB (evidence-based) programming Pre-RHU Programming was significantly associated with a substantially larger change in RHU placement
- A longer period post-program time at risk was associated with a smaller change in RHU Placements
- Participants in MRT Administrative Behavioral Modification Program exhibited a significantly smaller change as compared to participants in WKCC RHU Transition.
For Females:
- A longer duration of EB programming Pre-RHU Program was associated with larger changes in RHU placements
- A longer period post-program time at risk was associated with a smaller change in RHU Placements
For Males:
- An older age at the start of the program was associated with significantly larger changes in RHU placements
- A longer period post-program time at risk was associated with a smaller change in RHU Placements
Additional Observations:
- Participants from EKCC exhibited significantly smaller reductions in RHU Placements as compared to KCIW. This could be explained by EKCC’s later start/inclusion into the initiative.
- This same model revealed the same type of significant associations for level of education, level of mental health score, and duration of evidence-based programming.
Conclusion and Recommendations
This assessment of Restrictive Housing Programing offers preliminary and significant findings that favor positive results over a 5-year time span. These findings also present interesting information that can be utilized to continuously shape the programs in question, while also informing general administrative practices and policy. It is important to note that while KCIW, WKCC, and KSP started their programming on 5-15-2015, EKCC started programming in 2019, causing a smaller sample size. Furthermore, the onset of COVID-19 in March 2020 impacted the program’s delivery significantly, when groups and individual session occurred, and finally, the significant incentive of transitioning to another institution (typically closer to home). Thus, a limitation of the assessed variables includes factors that are outside of research control.
The information offered within this report, however, answers questions regarding the profile of the participants, by observing gender, age, race, level of education, mental health score, number of previous incarcerations, program location, program enrollment, program status, previous engagement in programming outside of RHU-specific programming (evidence-based, vocational, educational program), disciplinary infractions or DR’s, and trips to restrictive housing.
While descriptive variables and pre-program variables included the entire population size of 523 cases, additional analysis were conducted by splitting the population by gender. For post-program analysis, only 322 participants were included, namely those who completed the program in its entirety. Findings tell us that participants who are older in age, have higher mental health scores, have lower levels of education, have longer duration of evidence-based programming pre- or post- program, and sustain longer post-programming without risk have larger changes/declines in placements in Restrictive Housing. These findings point to the importance of considering risk factors associated with education and mental health, along with offering evidence-based programming, when providing treatment to incarcerated individuals, to include high-risk cases.
The fourth research question emerged from personal interest. A logistic regression analysis was conducted to assess return to prison for 149 cases representing program participants who were released from prison at that time the data were obtained for analysis. These were 149 cases from the total enrollments, rather than those who completed the program. Of those 149 cases that were exposed to RHU Programming, 16% (24) returned to prison. The logistic regression analysis identified significant predictors of returning to prison from this group of participants. Due to missing data for 3 cases, only 146 cases were included in the logistic regression analysis, which indicate:
- A higher level of MH score/diagnosis predicted a higher likelihood of return to prison
- A longer duration of evidence-based programming during both the Pre-RHU Program and Post-RHU Program time periods was associated with a lower likelihood of return to prison
- A longer period of post-release time-at-risk lowered the likelihood of returning to prison
Thus, recommendations can be drawn on the basis of these findings in terms of considerations of risk factors, engagement and availability of evidence-based programming, engagement post completion of RHU-Programming (pre-release), and heightened attention given to the early at-risk time following release. Mental Health assessment and treatment, and evidence-based programming, are both in the physical control of the Department where cases are housed. Thus, these indicators should assist in guiding relevant policies and procedures.
A more comprehensive study is suggested at a later time with larger population size and longer time Post-RHU Program completion. It would also be intriguing to compare participants pre-COVID-19 and post-COVID-19.
About the Authors:
David Myers, Ph.D., is a Professor and Chairperson of the Criminal Justice Department at the University of New Haven, as well as a consultant with Joyfields Institute for Evidence-Based Professions. He has published three books, and his research has appeared in such journals as Criminology and Public Policy, Crime & Delinquency, Youth Violence and Juvenile Justice, Criminal Justice and Behavior, and Crime Prevention and Community Safety. He has served as the Editor of Criminal Justice Policy Review, ACJS Today, Routledge Studies in Juvenile Justice and Delinquency, and EBP Quarterly, as well as President of the Association of Doctoral Programs in Criminology and Criminal Justice and an Executive Board Member of the Northeast Association of Criminal Justice Sciences and the Crime and Justice Research Alliance.
Lada Kloi Gasparac, MA, MPA, NASPAA – is a graduate of Western Kentucky University, where she obtained her BA in Psychology, Sociology, and Criminology, her Master of Public Administration Degree, and her Master of Criminology Degree with an emphasis on Behavioral Health research. She holds several certifications in evidence-based treatment modalities and is an avid admirer of behavioral health research. She has worked in the field of human science for 18 years, working with youth, young adults, and adults in the local, state, and federal system. She is the owner of NOA Counseling, LLC and has contributed to this study with her knowledge of the field and the program design, in order to better explain the observed outcomes.
Photo by David Coffing on Unsplash


Evidence-Based Professionals' Monthly - July 2026

Evidence-Based Professionals' Monthly - June 2026

Evidence-Based Professionals' Monthly - May 2026

Evidence-Based Professionals' Monthly - April 2026

Evidence-Based Professionals' Monthly - March 2026

Evidence-Based Professionals' Monthly - February 2026

Evidence-Based Professionals' Monthly - January 2026

Evidence-Based Professionals' Monthly - December 2025
